After finally finding the time to work on my own climate analysis platform again, I would like to release a new version of www.climateradar.com. I received great feedback and suggestions from my initial launch, so a lot of those requests are included in this upgrade.
For those who don't know ClimateRadar.com yet: it's a publicly available climate analysis platform that makes it easy for anyone to analyse historical and future weather events and trends. It is based on state-of-the-art reanalysis and bias-correct and downscaled climate model data. The focus is DIY – the tool allows you to do full scale climate analysis all by yourself. No technical background needed! See the figures below for some example analysis.
The main updates are:
• Besides country and regional data, it now also covers the major cities (~7300) around the world.
• Support for multiple languages [EN, NL, DE, ES, FR, IT, ..]. If you want your language added just let me know and I’ll make sure it is added. Please try out one of the languages and let me know how good the translations are.
• More fancy figure types supported. You can’t call yourself a climate analysis platform if you can’t make a ‘Warming Stripes’ plot so that had to be added (and many others).
• Observed weather in the future. You can now translate the actual weather you just experienced to what it will look like in 2035, 2050 or 2085. This is the so called ‘transformed timeseries’, where the delta between historical and future climate model data is applied to historically observed data.
• The reanalysis is available with a 5-day delay. This is very up to date already for all the processing involved, but still a bit ‘yesterday’s news’. In order to also be able analyse today’s weather the last 5 days are extended with GFS +24h forecasts.
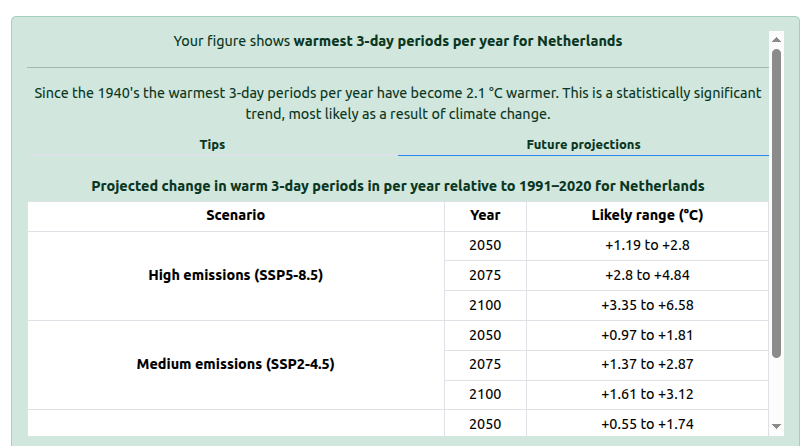
• AI assistent that can analyse the impact and meteorological drivers of extreme events.
• and many more updates under the hood..
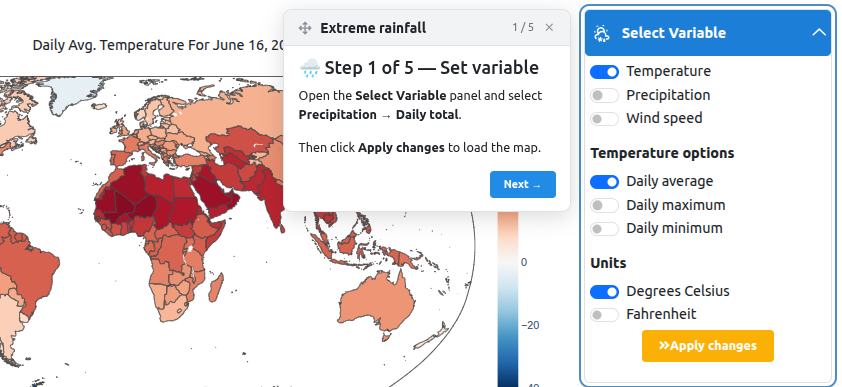
And with everything that has been happening weather-wise lately, there's plenty to analyse. As always there are some walkthroughs available for specific cases, but feel free to DIY ;-)
I'd love to hear what you think of the new version! What did you like? Where did you get stuck? Any bugs or missing features? Your feedback means a lot and directly shapes the next update.
If you have any ideas how this tool could be used for climate communication and climate education feel free to contact me. I’m actively looking for places where this tool can provide valuable insights. I'm also keen on funding opportunites, as this is fully self-funded (i.e. a fully out of control pet project..).![]()
![]()