Climate Analysis At Your Fingertips

ClimateRadar hosts a suite of free interactive tools to analyse our current climate — full trend and extreme-value analysis with global coverage with ClimateDIY, or ClimateOdds' day-by-day odds of suitable weather for any activity. Pick a tool below, or start ClimateDIY with a walkthrough or the main tool here.

Explore the Climate Tools
Get started with our interactive climate analysis tool — no expertise required.
DIY climate analysis →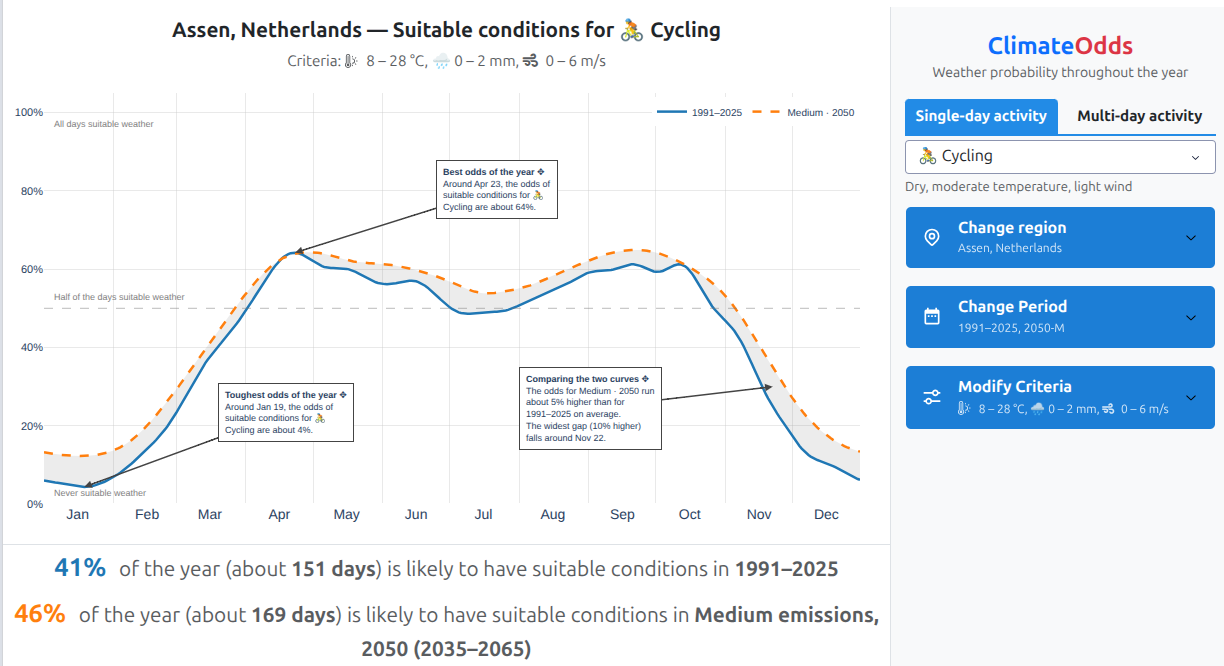
ClimateOdds
Analyse the odds of suitable weather for any outdoor activity, day by day throughout the year, for past, present and future.
Check the odds →
North America 2026 Cold Wave
How extreme was the 2026 cold wave over the USA and Canada?
Start analysis →
Eleven Cities Tour
How does climate change affect the chances of an 'Elfstedentocht'?
Start analysis →
ClimateRadar hosts a suite of free interactive tools to analyse our current climate, both for the general public and climate experts. ClimateDIY lets you do full-scale climate analysis all by yourself, ranging from simple trend analysis to extreme value analysis - all with global coverage. ClimateOdds takes a lighter-touch approach: the day-by-day odds of suitable weather for any outdoor activity, past, present and future. Pick a tool in the tabs below, or start ClimateDIY with a walkthrough (see below) to help you answer questions for specific events, or jump straight into the main tool here.
Dig into any location's climate, hands-on
ClimateDIY lets you explore trends and recent extremes of e.g. heatwaves, cold snaps and droughts yourself — with global coverage and no statistics background required. Start with a guided walkthrough, or jump straight into the main tool.
DIY climate analysis →
Plan around the weather, not against it
Whether it's a hike, a barbecue, or a week-long cycling trip, ClimateOdds shows the day-by-day odds of suitable conditions for dozens of activities — based on decades of historical data, with options to compare earlier periods or look ahead at future climate projections.
Check the odds →
North America 2026 Cold Wave
How extreme was the 2026 cold wave over the USA and Canada?
Start analysis →
Eleven Cities Tour
How does climate change affect the chances of an 'Elfstedentocht'?
Start analysis →
Today's Global Climate Extremes Drag to rotate · Click to analyse
Click an extreme to further analyse it!
Recent Updates
I've added a new tool: ClimateOdds . This tool allows to show the odds of suitable weather for many single …
I've changed the mapping feature from using plotly to dash-leaflet. Because dash-leaflet better support viewing many large geojson files (many …
With the latest update the tool is finally starting to look as what I envisioned from the start. In a …

ClimateRadar partners with Weather Trade Net for physical climate risk assessment products tailored for businesses — standardized, globally comparable, and ready for immediate use.

Full Global Coverage
Our physical climate risk assessments cover assets anywhere in the world — from Europe to Asia, the Americas to Africa.
Learn more →
Historical Risk Assessment
Determine the climate hazards that pose the greatest risk to each asset, drawing on more than 80 years of observational data.
Learn more →
Scenario Analysis Per Location
Understand how climate risk evolves under different future scenarios for each individual asset location.
Learn more →
Climate Indicators
Key climate indicators from historical trends to future scenarios — understanding how weather impacting your business will change.
Learn more →
Return Time & Probability Analysis
Quantify how climate change is shifting the likelihood of extreme weather events — ideal for financial impact assessments.
Learn more →
ClimateRadar partners with Weather Trade Net for providing a broad range of climate risk assessment products tailored for businesses. Our climate risk metrics are designed to help align risk management with investment decisions and meet new ESG compliance standards. These metrics are standardized, globally comparable, intuitive and complete. They're also structured for straightforward integration, easily accessible, and ready for immediate use.
Full Global Coverage
Our physical climate risk assessments cover assets anywhere in the world — from Europe to Asia, the Americas to Africa, no location is out of scope.
Learn more →
Historical Risk Assessment
Determine the climate hazards that pose the greatest risk to each specific asset, drawing on more than 80 years of observational data.
Learn more →
Scenario Analysis Per Location
Understand how climate risk evolves under different future scenarios for each individual asset location — enabling forward-looking, site-specific risk management.
Learn more →
Climate Indicators
Key climate indicators from historical trends to future scenarios — Understanding how the weather that is directly impacting your business will change towards the future.
Learn more →
Return Time & Probability Analysis
Quantify how climate change is shifting the likelihood of extreme weather events. Ideal input for financial impact assessments!
Learn more →